
The King's School Canterbury
Inspection Report
Independent School
What BS Portal think about The King's School Canterbury?
Thought to be the oldest school in the world, Kings School Canterbury combines a timely and authentically British setting with modern and researched teaching approaches, in order to give students the most thorough, and effective learning experience.
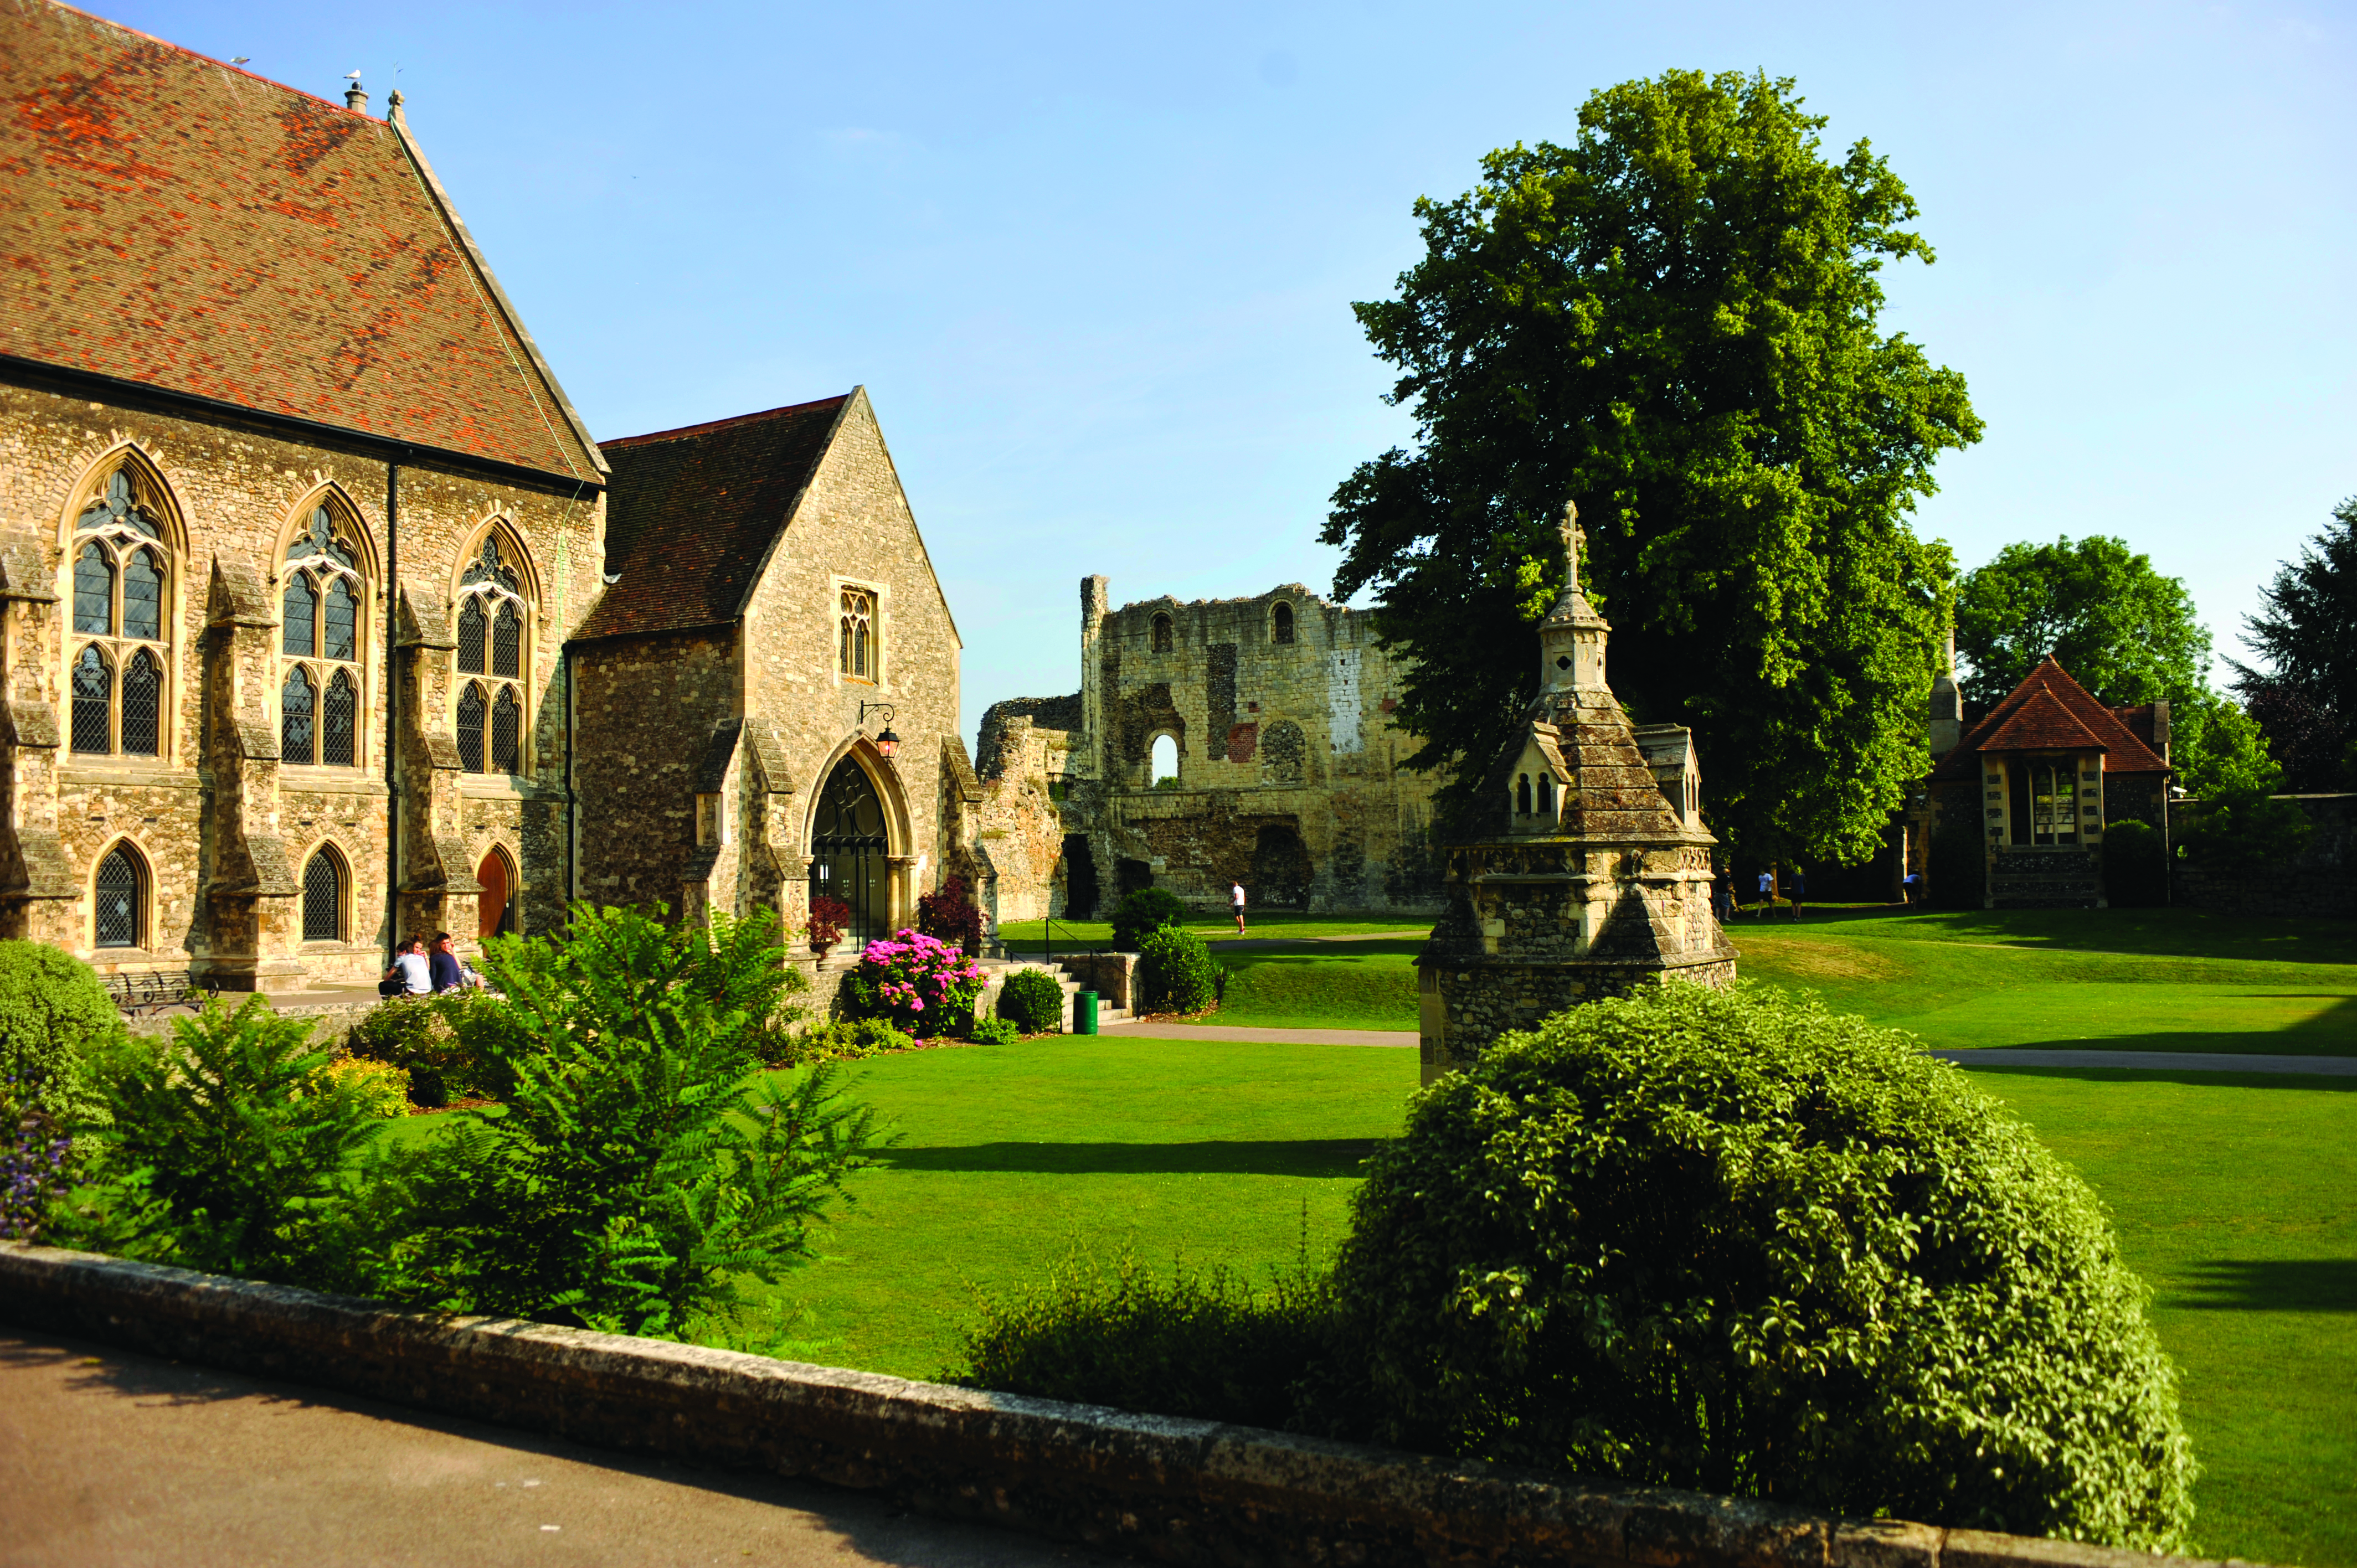
Having grown up in Canterbury and its surrounding areas, I have always been able to admire the majesty of King’s Schools facilities, as well as the stunning areas of beauty within the historic city of Canterbury, such as the Cathedral and its colourful and rich high street, where independent retailers have everything that could ever be needed for student life.
A school as old as Kings would have many traditions and celebrations, and Canterbury’s most prestigious boarding school doesn't disappoint. One particular tradition is known as “King’s Week”, which takes place on the last week of summer term, and features over 100 events celebrating the arts held in Canterbury and its wonderful surrounding areas.
Upon meeting the staff and some pupils on a virtual opening morning, I was fortunate enough to speak with the students, who are all immensely proud of Kings School, and their learning and developed great manners.
The Kings school aims to develop students into polite, articulate and thoughtful members of society. When hearing the pupils speak, it was very clear that through the community building and education at the school, that the goals of the oldest school are achieved in how pleasant it was whilst speaking to them.
The pastoral care at Kings is superb, giving students the support and care needed, whilst allowing them to develop and learn in the university campus-like city of Canterbury.
The kitchen at Kings Canterbury provides a wide array of foods, and gives pupils the choice of vegetarian, hot food, cold food, pastas and anything that you could think of. The kitchen is open to both boarders and day pupils for dinner, allowing friendships and connections between pupils that go home at the end of the school day and those that don’t, so regardless of if you're looking to board in the heart of the city, or find somewhere to live nearby, friendships at Kings are always availible.
3 selling points of the school:
one of the country’s leading co-educational boarding and day schools
situated in the Precincts of Canterbury Cathedral, a UNESCO World Heritage Site, providing a beautiful and inspiring backdrop
22 acre multi-purpose sports
School Data
Print
Head's Name
Ms Jude Lowson
Residency Type
Boarding School , Day School
Gender Profile
Number of Pupils / School Capacity
925 / 911
Curriculum Covered
Year 9 (Age 13-14)
Year 10 (Age 14-15)
Year 11 (Age 15-16)
Year 12 (Age 16-17)
Year 13 (Age 17-18)
Boys
491
Girls
420
DfE reference no.
886/6048
UKPRN
10008320
The UKPRN is a unique number allocated to providers after successful UKRLP registration (UK Register of Learning Providers).
| Type of School: | Independent schools Other independent school |
| Age range: | 13 - 18 |
| Boarding Provision: | Boarding school |
| Urban / Rural: | (England/Wales) Urban city and town |
| Special Classes: | No Special Classes |
| Admissions Policy: | Selective |
| Local authority name: | Kent |
Fees
| Per Term (£) | ||||
| Day School | Full boarding | |||
| Year 9 (Age 13-14) | 8,375 | 13,285 | ||
| Year 10 (Age 14-15) | 8,830 | 13,285 | ||
| Year 11 (Age 15-16) | 8,830 | 13,285 | ||
| Year 12 (Age 16-17) | 9,300 | 13,285 | ||
| Year 13 (Age 17-18) | 9,300 | 13,285 | ||
| Annual (£) | ||||
Registration Fee
£200 (Non-refundable)
Term Dates
YYYY-MM-DD
Autumn
Spring
Summer
| Autumn Starts | Autumn Ends | Autumn HalfTerm Starts | Autumn HalfTerm Ends |
| 2021-09-07 | 2021-11-07 | 2021-10-22 | 2021-12-17 |
Spring
| Spring Starts | Spring Ends | Spring HalfTerm Starts | Spring HalfTerm Ends |
| 2022-01-10 | 2022-03-25 | 2022-02-11 | 2022-02-20 |
Summer
| Summer Starts | Summer Ends | Summer HalfTerm Starts | Summer HalfTerm Ends |
| 2022-04-20 | 2022-07-07 | 2022-05-27 | 2022-06-05 |
YYYY-MM-DD
School Performance Print 23/24
No primary test or assessment data has been published for 2020, 2021 or 2022
A total of 217
Pupils were at the end of key stage 4
| Attainment 8 | School | Local Authority | England |
| Average score per pupil | 17.5 | NA | NA |
| Average score per pupil - EBacc element | 9.2 | NA | NA |
| Average score per pupil - Open element | 8.3 | NA | NA |
| Average score per pupil - Open element GCSE only | 8 | NA | NA |
| Average score per pupil - Open element Non-GCSE only | 0.3 | NA | NA |
| Progress 8 | School | Local Authority | England |
| Number of pupils in the progress measure | NP | NA | NA |
| Measure after adjustment for extreme scores | NP | NA | NA |
| Measure for English element | NP | NA | NA |
| Measure for mathematics element | NP | NA | NA |
| Measure for EBacc element | NP | NA | NA |
| Measure for open element | NP | NA | NA |
| Percentage of pupils achieving standard 9-4 passes in both English and mathematics GCSEs | 0.00% | NA | NA |
| Percentage of pupils achieving strong 9-5 passes in both English and mathematics GCSEs | 0.00% | NA | NA |
| EBacc (English Baccalaureate) | School | Local Authority | England |
| Average score per pupil | 1.15 | NA | NA |
| Percentage of KS4 pupils with entries in all EBacc subject areas | 0.00% | NA | NA |
| Percentage of pupils achieving with 9-4 passes | 0.00% | NA | NA |
| Percentage of pupils achieving with 9-5 passes | 0.00% | NA | NA |
| Percentage of pupils entering the English subject area | 0.00% | NA | NA |
| Percentage of pupils achieving the English subject area with a standard 9-4 pass | 0.00% | NA | NA |
| Percentage of pupils achieving the English subject area with a strong 9-5 pass | 0.00% | NA | NA |
| Percentage of pupils entering the Maths subject area | 0.00% | NA | NA |
| Percentage of pupils achieving the Maths subject area with a standard 9-4 pass | 0.00% | NA | NA |
| Percentage of pupils achieving the Maths subject area with a strong 9-5 pass | 0.00% | NA | NA |
| Percentage of pupils entering the Science subject area | 0.00% | NA | NA |
| Percentage of pupils achieving the Science subject area with a standard 9-4 pass | NE | NA | NA |
| Percentage of pupils achieving the Science subject area with a strong 9-5 pass | NE | NA | NA |
| Percentage of pupils entering the Humanities subject area | 0.00% | NA | NA |
| Percentage of pupils achieving the Humanities subject area with a standard 9-4 pass | NE | NA | NA |
| Percentage of pupils achieving the Humanities subject area with a strong 9-5 pass | NE | NA | NA |
| Percentage of pupils entering the Language subject area | 86.20% | NA | NA |
| Percentage of pupils achieving the Language subject area with a standard 9-4 pass | 99.50% | NA | NA |
| Percentage of pupils achieving the Language subject area with a strong 9-5 pass | 96.30% | NA | NA |
| EAL (English as additional language) | |
| Number of pupils at the end of key stage 4 with English as additional language (EAL) | NP |
| Percentage of pupils at the end of key stage 4 with English as additional language (EAL) | NP |
| Average Attainment 8 score per EAL pupil | NP |
| Average Attainment 8 score per EAL pupil for English element | NP |
| Average Attainment 8 score per EAL pupil for mathematics element | NP |
| Average Attainment 8 score per EAL pupil for EBacc element | NP |
| Average Attainment 8 score per EAL pupil for open element | NP |
| Average Attainment 8 score per EAL pupil - GCSE only | NP |
| Average Attainment 8 score per EAL pupil - non-GCSE only | NP |
| Adjusted Progress 8 measure for EAL pupils | NP |
| Average point score EBacc per EAL pupil | NP |
| Percentage of EAL pupils with entries in all English Baccalaureate subject areas | NP |
| Percentage of EAL pupils achieving the English Baccalaureate with 9-4 passes | NP |
| Percentage of EAL pupils achieving the English Baccalaureate with 9-5 passes | NP |
|
SEN Support (Special educational needs and disabilities) EHC plan (Education, Health and Care plan) |
|
| Percentage of pupils at the end of key stage 4 with special educational needs (SEN) including those with or without a statement or Education, health and care (EHC) plan | NA |
A total of 205
Pupils were at the end of key stage 4
| Attainment 8 | School | Local Authority | England |
| Average score per pupil | 16 | 47 | 44.6 |
| Average score per pupil - EBacc element | 8.3 | 13.5 | 13.1 |
| Average score per pupil - Open element | 7.7 | 14.3 | 13.6 |
| Average score per pupil - Open element GCSE only | 7.6 | 11.5 | 11.1 |
| Average score per pupil - Open element Non-GCSE only | 0.2 | 2.8 | 2.4 |
| Progress 8 | School | Local Authority | England |
| Number of pupils in the progress measure | NP | 16749 | NA |
| Measure after adjustment for extreme scores | NP | -0.12 | NA |
| Measure for English element | NP | -0.15 | NA |
| Measure for mathematics element | NP | -0.15 | NA |
| Measure for EBacc element | NP | -0.16 | NA |
| Measure for open element | NP | -0.08 | NA |
| Percentage of pupils achieving standard 9-4 passes in both English and mathematics GCSEs | 0% | 66%% | 61%% |
| Percentage of pupils achieving strong 9-5 passes in both English and mathematics GCSEs | 0% | 47%% | 42%% |
| EBacc (English Baccalaureate) | School | Local Authority | England |
| Average score per pupil | 1.11 | 4.12 | 3.88 |
| Percentage of KS4 pupils with entries in all EBacc subject areas | 0% | 40%% | 36%% |
| Percentage of pupils achieving with 9-4 passes | 0% | 28%% | 22%% |
| Percentage of pupils achieving with 9-5 passes | 0% | 20%% | 16%% |
| Percentage of pupils entering the English subject area | 0% | 94%% | 88%% |
| Percentage of pupils achieving the English subject area with a standard 9-4 pass | 0% | 75%% | 70%% |
| Percentage of pupils achieving the English subject area with a strong 9-5 pass | 0% | 61%% | 57%% |
| Percentage of pupils entering the Maths subject area | 0% | 96%% | 90%% |
| Percentage of pupils achieving the Maths subject area with a standard 9-4 pass | 0% | 71%% | 66%% |
| Percentage of pupils achieving the Maths subject area with a strong 9-5 pass | 0% | 53%% | 48%% |
| Percentage of pupils entering the Science subject area | 0% | 93%% | 89%% |
| Percentage of pupils achieving the Science subject area with a standard 9-4 pass | NE | 67%% | 66%% |
| Percentage of pupils achieving the Science subject area with a strong 9-5 pass | NE | 50%% | 49%% |
| Percentage of pupils entering the Humanities subject area | 0% | 81%% | 77%% |
| Percentage of pupils achieving the Humanities subject area with a standard 9-4 pass | NE | 63%% | 64%% |
| Percentage of pupils achieving the Humanities subject area with a strong 9-5 pass | NE | 51%% | 52%% |
| Percentage of pupils entering the Language subject area | 87% | 46%% | 44%% |
| Percentage of pupils achieving the Language subject area with a standard 9-4 pass | 96% | 74%% | 72%% |
| Percentage of pupils achieving the Language subject area with a strong 9-5 pass | 95% | 59%% | 58%% |
| EAL (English as additional language) | |
| Number of pupils at the end of key stage 4 with English as additional language (EAL) | NP |
| Percentage of pupils at the end of key stage 4 with English as additional language (EAL) | NP |
| Average Attainment 8 score per EAL pupil | NP |
| Average Attainment 8 score per EAL pupil for English element | NP |
| Average Attainment 8 score per EAL pupil for mathematics element | NP |
| Average Attainment 8 score per EAL pupil for EBacc element | NP |
| Average Attainment 8 score per EAL pupil for open element | NP |
| Average Attainment 8 score per EAL pupil - GCSE only | NP |
| Average Attainment 8 score per EAL pupil - non-GCSE only | NP |
| Adjusted Progress 8 measure for EAL pupils | NP |
| Average point score EBacc per EAL pupil | NP |
| Percentage of EAL pupils with entries in all English Baccalaureate subject areas | NP |
| Percentage of EAL pupils achieving the English Baccalaureate with 9-4 passes | NP |
| Percentage of EAL pupils achieving the English Baccalaureate with 9-5 passes | NP |
|
SEN Support (Special educational needs and disabilities) EHC plan (Education, Health and Care plan) |
|
| Percentage of pupils at the end of key stage 4 with special educational needs (SEN) including those with or without a statement or Education, health and care (EHC) plan | NA |
A total of NA
Pupils were at the end of key stage 4
| Attainment 8 | School | Local Authority | England |
| Average score per pupil | NA | 49.3 | 48.9 |
| Average score per pupil - English element | NA | 10.5 | 10.4 |
| Average score per pupil - mathematics element | NA | 9.5 | 9.5 |
| Average score per pupil - EBacc element | NA | 14.3 | 14.2 |
| Average score per pupil - Open element | NA | 15.1 | 14.8 |
| Average score per pupil - Open element GCSE only | NA | 15.1 | 14.8 |
| Average score per pupil - Open element Non-GCSE only | NA | 3.1 | 2.8 |
| Progress 8 | School | Local Authority | England |
| Number of pupils in the progress measure | NA | 16145 | 553527 |
| Measure after adjustment for extreme scores | NA | -0.19 | -0.03 |
| Measure for English element | NA | -0.19 | -0.05 |
| Measure for mathematics element | NA | -0.24 | -0.03 |
| Measure for EBacc element | NA | -0.24 | -0.04 |
| Measure for open element | NA | -0.13 | -0.04 |
| Percentage of pupils achieving standard 9-4 passes in both English and mathematics GCSEs | NA | 68.7% | 69% |
| Percentage of pupils achieving strong 9-5 passes in both English and mathematics GCSEs | NA | 49.9% | 50% |
| EBacc (English Baccalaureate) | School | Local Authority | England |
| Average score per pupil | NA | 4.33 | 4.28 |
| Percentage of KS4 pupils with entries in all EBacc subject areas | NA | 41.5% | 38.8% |
| Percentage of pupils achieving with 9-4 passes | NA | 30.3% | 26.9% |
| Percentage of pupils achieving with 9-5 passes | NA | 24% | 20.3% |
| Percentage of pupils entering the English subject area | NA | 94.3% | 94.9% |
| Percentage of pupils achieving the English subject area with a standard 9-4 pass | NA | 78.2% | 79% |
| Percentage of pupils achieving the English subject area with a strong 9-5 pass | NA | 65.6% | 65.6% |
| Percentage of pupils entering the Maths subject area | NA | 96.6% | 96.7% |
| Percentage of pupils achieving the Maths subject area with a standard 9-4 pass | NA | 72.8% | 72.9% |
| Percentage of pupils achieving the Maths subject area with a strong 9-5 pass | NA | 54.7% | 54.9% |
| Percentage of pupils entering the Science subject area | NA | 93.8% | 95% |
| Percentage of pupils achieving the Science subject area with a standard 9-4 pass | NA | 68.9% | 69.3% |
| Percentage of pupils achieving the Science subject area with a strong 9-5 pass | NA | 52.2% | 51.4% |
| Percentage of pupils entering the Humanities subject area | NA | 82.9% | 81.6% |
| Percentage of pupils achieving the Humanities subject area with a standard 9-4 pass | NA | 69.2% | 69.8% |
| Percentage of pupils achieving the Humanities subject area with a strong 9-5 pass | NA | 57.2% | 57.3% |
| Percentage of pupils entering the Language subject area | NA | 47.1% | 44.9% |
| Percentage of pupils achieving the Language subject area with a standard 9-4 pass | NA | 78.4% | 76.3% |
| Percentage of pupils achieving the Language subject area with a strong 9-5 pass | NA | 68.3% | 65.5% |
| EAL (English as additional language) | |
| Percentage of pupils at the end of key stage 4 with English as additional language (EAL) | NP |
| Average Attainment 8 score per EAL pupil | NP |
| Average Attainment 8 score per EAL pupil for English element | NP |
| Average Attainment 8 score per EAL pupil for mathematics element | NP |
| Average Attainment 8 score per EAL pupil for EBacc element | NP |
| Average Attainment 8 score per EAL pupil for open element | NP |
| Average Attainment 8 score per EAL pupil - GCSE only | NP |
| Average Attainment 8 score per EAL pupil - non-GCSE only | NP |
| Adjusted Progress 8 measure for EAL pupils | NP |
| Average point score EBacc per EAL pupil | NP |
| Percentage of EAL pupils with entries in all English Baccalaureate subject areas | NP |
| Percentage of EAL pupils achieving the English Baccalaureate with 9-4 passes | NP |
| Percentage of EAL pupils achieving the English Baccalaureate with 9-5 passes | NP |
|
SEN Support (Special educational needs and disabilities) EHC plan (Education, Health and Care plan) |
|
| Percentage of pupils at the end of key stage 4 with special educational needs (SEN) including those with or without a statement or Education, health and care (EHC) plan | NA |
A total of 189
Pupils were at the end of key stage 4
| Attainment 8 | School | Local Authority | England |
| Average score per pupil | 10.8 | 47.4 | 46.8 |
| Average score per pupil - English element | 0.1 | 10 | 10 |
| Average score per pupil - EBacc element | 2.4 | 13.6 | 13.5 |
| Average score per pupil - Open element | 8.3 | 14.6 | 14.3 |
| Average score per pupil - Open element GCSE only | 8.3 | 11.4 | 11.6 |
| Progress 8 | School | Local Authority | England |
| Number of pupils in the progress measure | NP | 6608 | 219129 |
| Measure after adjustment for extreme scores | NP | -0.11 | -0.03 |
| Measure for English element | NP | -0.17 | -0.04 |
| Measure for mathematics element | NP | -0.11 | -0.02 |
| Measure for EBacc element | NP | -0.15 | -0.03 |
| Measure for open element | NP | -0.05 | -0.04 |
| Percentage of pupils achieving standard 9-4 passes in both English and mathematics GCSEs | 0% | 65.7% | 64.9% |
| Percentage of pupils achieving strong 9-5 passes in both English and mathematics GCSEs | 0% | 45.6% | 43.4% |
| EBacc (English Baccalaureate) | School | Local Authority | England |
| Average score per pupil | 0.34 | 4.16 | 4.08 |
| Percentage of KS4 pupils with entries in all EBacc subject areas | 0% | 44.3% | 40.1% |
| Percentage of pupils achieving with 9-4 passes | 0% | 29.5% | 25.1% |
| Percentage of pupils achieving with 9-5 passes | 0% | 21.4% | 17.2% |
| Percentage of pupils entering the English subject area | 0% | 95.1% | 96% |
| Percentage of pupils achieving the English subject area with a standard 9-4 pass | 0% | 74.9% | 76.1% |
| Percentage of pupils achieving the English subject area with a strong 9-5 pass | 0% | 60.5% | 60.8% |
| Percentage of pupils entering the Maths subject area | 0% | 97% | 97.3% |
| Percentage of pupils achieving the Maths subject area with a standard 9-4 pass | 0% | 71.3% | 70.2% |
| Percentage of pupils achieving the Maths subject area with a strong 9-5 pass | 0% | 51.3% | 49.3% |
| Percentage of pupils entering the Science subject area | 0% | 95.4% | 95.7% |
| Percentage of pupils achieving the Science subject area with a standard 9-4 pass | NE | 65.6% | 65.5% |
| Percentage of pupils achieving the Science subject area with a strong 9-5 pass | NE | 49% | 46.9% |
| Percentage of pupils entering the Humanities subject area | 0% | 81.4% | 80.9% |
| Percentage of pupils achieving the Humanities subject area with a standard 9-4 pass | NE | 62.7% | 62.8% |
| Percentage of pupils achieving the Humanities subject area with a strong 9-5 pass | NE | 51.3% | 50.2% |
| Percentage of pupils entering the Language subject area | 26% | 50.5% | 46.7% |
| Percentage of pupils achieving the Language subject area with a standard 9-4 pass | 100% | 70.7% | 70.1% |
| Percentage of pupils achieving the Language subject area with a strong 9-5 pass | 98% | 55.3% | 54.2% |
| EAL (English as additional language) | |
| Percentage of pupils at the end of key stage 4 with English as additional language (EAL) | NP |
| Average Attainment 8 score per EAL pupil | NP |
| Average Attainment 8 score per EAL pupil for English element | NP |
| Average Attainment 8 score per EAL pupil for mathematics element | NP |
| Average Attainment 8 score per EAL pupil for EBacc element | NP |
| Average Attainment 8 score per EAL pupil for open element | NP |
| Average Attainment 8 score per EAL pupil - GCSE only | NP |
| Average Attainment 8 score per EAL pupil - non-GCSE only | NP |
| Adjusted Progress 8 measure for EAL pupils | NP |
| Average point score EBacc per EAL pupil | NP |
| Percentage of EAL pupils with entries in all English Baccalaureate subject areas | NP |
| Percentage of EAL pupils achieving the English Baccalaureate with 9-4 passes | NP |
| Percentage of EAL pupils achieving the English Baccalaureate with 9-5 passes | NP |
|
SEN Support (Special educational needs and disabilities) EHC plan (Education, Health and Care plan) |
|
| Percentage of pupils at the end of key stage 4 with special educational needs (SEN) including those with or without a statement or Education, health and care (EHC) plan | NA |
A total of 189
Pupils were at the end of key stage 4
| Attainment 8 | School | Local Authority | England |
| Average score per pupil | 12.4 | 47.1 | 44.5 |
| Progress 8 | School | Local Authority | England |
| Number of pupils in the progress measure | NA | 14634 | NA |
| Measure after adjustment for extreme scores | NA | -0.08 | NA |
| Measure for open element | NP | -0.01 | NA |
| Percentage of pupils achieving standard 9-4 passes in both English and mathematics GCSEs | 0% | 63.8% | 59.4% |
| Percentage of pupils achieving strong 9-5 passes in both English and mathematics GCSEs | 0% | 44.2% | 40.2% |
| EBacc (English Baccalaureate) | School | Local Authority | England |
| Average score per pupil | 0.61 | 4.11 | 3.85 |
| Percentage of pupils achieving with 9-4 passes | 0% | 27.9% | 22.2% |
| Percentage of pupils achieving with 9-5 passes | 0% | 20.8% | 15.4% |
A total of 189
Pupils were at the end of key stage 4
| Attainment 8 | School | Local Authority | England |
| Average score per pupil | 21.3 | 46.3 | 44.6 |
| Progress 8 | School | Local Authority | England |
| Number of pupils in the progress measure | NA | 14493 | NA |
| Measure after adjustment for extreme scores | NA | -0.11 | NA |
| Measure for open element | NP | -0.01 | NA |
| Percentage of pupils achieving standard 9-4 passes in both English and mathematics GCSEs | 0% | 61.9% | 59.1% |
| Percentage of pupils achieving strong 9-5 passes in both English and mathematics GCSEs | 0% | 42.3% | 39.6% |
| EBacc (English Baccalaureate) | School | Local Authority | England |
| Percentage of pupils achieving with 9-4 passes | 0% | 27% | 21.9% |
| Percentage of pupils achieving with 9-5 passes | 0% | 24.9% | 19.7% |
| A Level | 0.24 |
| Number of 16-18 year old students in sixth form: | 381 |
| Number of students aged 16-18 at the end of KS5 (includes students who entered for advanced level 3 qualifications or below-level 3 qualifications): | 160 |
| School | Local Authority | England | |
| Number of students at the end of KS5 who entered for at least one AS or A level qualification | 159 | ||
| Average point score per A level entry | 44.69 | ||
| Average point score per A level entry expressed as a grade | B+ |
| Best 3 A levels measures | School | Local Authority | England |
| Number of students included | 124 | ||
| Average point score | 43.90 | ||
| Average point score expressed as a grade | B+ |
| A Level with AAB measure At least three A Level Subjects with at least two of which are in facilitating subjects (Biology, Chemistry, Physics, Mathematics, Further Mathematics, Geography, History, English Literature, and Classical/Modern Languages) | School | Local Authority | England |
| Number of students included | 124 | ||
| Percentage of students included | 37.9% | % | % |
| Entered for at least one advanced (level 3) academic qualification | School | Local Authority | England |
| Number of students at the end of KS5 | 159 | ||
| Average point score | 44.83 | ||
| Average point score expressed as a grade | B+ |
| Entered for at least one applied general qualification | School | Local Authority | England |
| Number of students at the end of KS5 | 5 | ||
| Average point score | SUPP | ||
| Average point score expressed as a grade | SUPP |
| Entered for at least one tech level qualification | School | Local Authority | England |
| Number of students at the end of KS5 | NE | ||
| Average point score | NE | ||
| Average point score expressed as a grade | NE |
| Number of 16-18 year old students in sixth form: | 397 |
| Number of students aged 16-18 at the end of KS5 (includes students who entered for advanced level 3 qualifications or below-level 3 qualifications): | 219 |
| School | Local Authority | England | |
| Number of students at the end of KS5 who entered for at least one AS or A level qualification | 215 | ||
| Average point score per A level entry | 44.31 | ||
| Average point score per A level entry expressed as a grade | B+ |
| Best 3 A levels measures | School | Local Authority | England |
| Number of students included | 165 | ||
| Average point score | 43.45 | ||
| Average point score expressed as a grade | B+ |
| A Level with AAB measure At least three A Level Subjects with at least two of which are in facilitating subjects (Biology, Chemistry, Physics, Mathematics, Further Mathematics, Geography, History, English Literature, and Classical/Modern Languages) | School | Local Authority | England |
| Number of students included | 165 | ||
| Percentage of students included | 35.80% | % | % |
| Entered for at least one advanced (level 3) academic qualification | School | Local Authority | England |
| Number of students at the end of KS5 | 215 | ||
| Average point score | 44.39 | ||
| Average point score expressed as a grade | B+ |
| Entered for at least one applied general qualification | School | Local Authority | England |
| Number of students at the end of KS5 | 4 | ||
| Average point score | SUPP | ||
| Average point score expressed as a grade | SUPP |
| Entered for at least one tech level qualification | School | Local Authority | England |
| Number of students at the end of KS5 | NE | ||
| Average point score | NE | ||
| Average point score expressed as a grade | NE |
| Number of 16-18 year old students in sixth form: | 403 |
| Number of students aged 16-18 at the end of KS5 (includes students who entered for advanced level 3 qualifications or below-level 3 qualifications): | 169 |
| School | Local Authority | England | |
| Number of students at the end of KS5 who entered for at least one AS or A level qualification | 167 | ||
| Average point score per A level entry | 45.54 | ||
| Average point score per A level entry expressed as a grade | A- |
| Best 3 A levels measures | School | Local Authority | England |
| Number of students included | 124 | ||
| Average point score | 44.25 | ||
| Average point score expressed as a grade | B+ |
| A Level with AAB measure At least three A Level Subjects with at least two of which are in facilitating subjects (Biology, Chemistry, Physics, Mathematics, Further Mathematics, Geography, History, English Literature, and Classical/Modern Languages) | School | Local Authority | England |
| Number of students included | 124 | ||
| Percentage of students included | 38.70% | % | % |
| Entered for at least one advanced (level 3) academic qualification | School | Local Authority | England |
| Number of students at the end of KS5 | 167 | ||
| Average point score | 45.87 | ||
| Average point score expressed as a grade | A- |
| Entered for at least one applied general qualification | School | Local Authority | England |
| Number of students at the end of KS5 | 4 | ||
| Average point score | SUPP | ||
| Average point score expressed as a grade | SUPP |
| Entered for at least one tech level qualification | School | Local Authority | England |
| Number of students at the end of KS5 | NE | ||
| Average point score | NE | ||
| Average point score expressed as a grade | NE |
| A Level | -0.17 |
Below average (About 25% of schools/colleges in England)
5%
17%
48%
25%
5%
|
| Academic | -0.15 |
Below average (About 25% of schools/colleges in England)
5%
17%
47%
25%
5%
|
| Number of 16-18 year old students in sixth form: | 389 |
| Number of students aged 16-18 at the end of KS5 (includes students who entered for advanced level 3 qualifications or below-level 3 qualifications): | 179 |
| School | Local Authority | England | |
| Number of students at the end of KS5 who entered for at least one AS or A level qualification | 177 | 5041 | 226301 |
| Average point score per A level entry | 42.78 | 33.18 | 33.77 |
| Average point score per A level entry expressed as a grade | B+ | C+ | C+ |
| Best 3 A levels measures | School | Local Authority | England |
| Number of students included | 99 | 6963 | 289623 |
| Average point score | 42.76 | 33.9 | 33.26 |
| Average point score expressed as a grade | B+ | C+ | C+ |
| A Level with AAB measure At least three A Level Subjects with at least two of which are in facilitating subjects (Biology, Chemistry, Physics, Mathematics, Further Mathematics, Geography, History, English Literature, and Classical/Modern Languages) | School | Local Authority | England |
| Number of students included | 99 | 6963 | 289623 |
| Percentage of students included | 39.4% | 15.6% | 15.8% |
| Entered for at least one advanced (level 3) academic qualification | School | Local Authority | England |
| Number of students at the end of KS5 | 179 | 7925 | 296751 |
| Average point score | 43.40 | 34.13 | 34.09 |
| Average point score expressed as a grade | B+ | C+ | C+ |
| Entered for at least one applied general qualification | School | Local Authority | England |
| Number of students at the end of KS5 | 2 | 2692 | 64822 |
| Average point score | SUPP | 27.31 | 28.37 |
| Average point score expressed as a grade | SUPP | Merit+ | Merit+ |
| Entered for at least one tech level qualification | School | Local Authority | England |
| Number of students at the end of KS5 | NE | 648 | 19468 |
| Average point score | NE | 28.41 | 28.43 |
| Average point score expressed as a grade | NE | Merit+ | Merit+ |
| School | Local Authority | England | |
| Number of students achieving a TechBacc (ie, a tech level, an extended project qualification and core maths or equivalent maths qualification) | NE | 25 | 178 |
| A Level | -0.08 |
Average (About 48% of schools/colleges in England)
5%
17%
48%
24%
5%
|
| Academic | -0.12 |
Below average (About 24% of schools/colleges in England)
5%
17%
49%
24%
6%
|
| Number of students aged 16-18 at the end of KS5 (includes students who entered for advanced level 3 qualifications or below-level 3 qualifications): | 181 |
| School | Local Authority | England | |
| Number of students at the end of KS5 who entered for at least one AS or A level qualification | 178 | 5520 | 230827 |
| Average point score per A level entry | 43.72 | 31.9 | 33.33 |
| Average point score per A level entry expressed as a grade | B+ | C+ | C+ |
| Entered for at least one advanced (level 3) academic qualification | School | Local Authority | England |
| Number of students at the end of KS5 | 180 | 8449 | 305503 |
| Average point score | 43.95 | 33.13 | 33.66 |
| Average point score expressed as a grade | B+ | C+ | C+ |
| Entered for at least one applied general qualification | School | Local Authority | England |
| Number of students at the end of KS5 | NE | 2104 | 45797 |
| Average point score | NE | 27.79 | 28.45 |
| Average point score expressed as a grade | NE | Merit+ | Merit+ |
| Entered for at least one tech level qualification | School | Local Authority | England |
| Number of students at the end of KS5 | NE | 366 | 12829 |
| Average point score | NE | 30.72 | 28.1 |
| Average point score expressed as a grade | NE | Dist- | Merit+ |
| Academic | 0.00 |
| Number of students aged 16-18 at the end of KS5 (includes students who entered for advanced level 3 qualifications or below-level 3 qualifications): | 194 |
| School | Local Authority | England | |
| Number of students at the end of KS5 who entered for at least one AS or A level qualification | 191 | 5263 | 222084 |
| Average point score per A level entry | 45.35 | 30.83 | 32.39 |
| Average point score per A level entry expressed as a grade | A- | C | C+ |
| Entered for at least one advanced (level 3) academic qualification | School | Local Authority | England |
| Number of students at the end of KS5 | 193 | 8874 | 321535 |
| Average point score | 45.78 | 32.1 | 32.72 |
| Average point score expressed as a grade | A- | C+ | C+ |
| Entered for at least one applied general qualification | School | Local Authority | England |
| Number of students at the end of KS5 | 1 | 3891 | 123715 |
| Average point score | SUPP | 36.52 | 35.72 |
| Average point score expressed as a grade | SUPP | Dist | Dist |
| Entered for at least one tech level qualification | School | Local Authority | England |
| Number of students at the end of KS5 | NE | 1905 | 64453 |
| Average point score | NE | 31.03 | 32.26 |
| Average point score expressed as a grade | NE | Dist- | Dist- |
Comment
0 |
comments
- No Comment -